Search
This is the third resident satisfaction survey for the City of St. John’s. The 2018 survey provided a benchmark from which the City can measure any changes in priorities and provide ongoing performance measurement following the implementation of the 2019 Strategic Plan. The survey was repeated in 2020 and again in the fall of 2022.
The key objectives of this survey are to:
- Provide further input into the City’s strategic planning and budget processes
- Identify priority issues and priority programs and services
- Gauge resident awareness, perception of, and satisfaction with, City programs and services
- Identify gaps in services (gap analysis of service importance vs. satisfaction)
- Understand the current financial and housing situation among residents
- Measure progress/improvement over time
- Provide data for the City’s developing performance management systems
Methodology
A telephone methodology was used for this study with both active landline and cellular numbers making up the sampling frame. The survey was conducted between September 22 and October 13, 2022. It was designed by MQO Research in consultation with the City of St. John’s.
A total of 603 surveys were completed (168 landline / 435 cell) resulting in an overall margin of error of ± 4.0 percentage points 19 times out of 20. The sample size was increased from 500 to 600 in 2022 to capture more residents who identify as one or more minority groups.
120 surveys were completed in each of the 5 Wards of the City using a stratified sampling approach. This was an increase from 100 per ward in 2020. The margin of error for results at the level of each ward is ± 8.9 percentage points 19 times out of 20.
The results were weighted by age and gender based on the most recent census data.
Demographics
- 75% of respondents do not have children living at home.
- Demographics by household income: 23% less than $50,000; 30% are between $50,000 and $99,999); and 47% are over $100,000.
- St. John’s has a well-educated demographic. Fully 76% of respondents have completed university or college or post graduate studies. 11% of respondents had high school or less.
- Regarding minority status: 8% identified as a visible minority, 3% indigenous; 14% as people with disabilities; and 8% asLGBTQ2IA+.
- 57% of respondents are employed; 29% are retired; 9% are students; and 5% are unemployed.
Context
In interpreting the results from this study, it is important to keep in mind the current economic and political climate. Issues such as rising inflation, recession fears and concerns about affordable housing underscore some of the challenges facing residents which may be reflected in the survey results.
A poll by Research Co in July 2022 finds that 81% of Canadians expect higher prices for a week’s worth of groceries over the next six months, and 40% of Canadians describe the country’s economic conditions as “very good” or “good” today. Many regions’ ratings are even lower, including Atlantic Canada (36%).
The Government of NL reports that prices for consumer goods and services increased by 6.4% from January-August in 2022, compared to the same period in 2021. Prices for essentials such as food (8.6%) and shelter (5.8%) also saw significant increases.
Satisfaction with the provincial government declined from 63% in August 2021 to 47% in August 2022.

Quality of Life
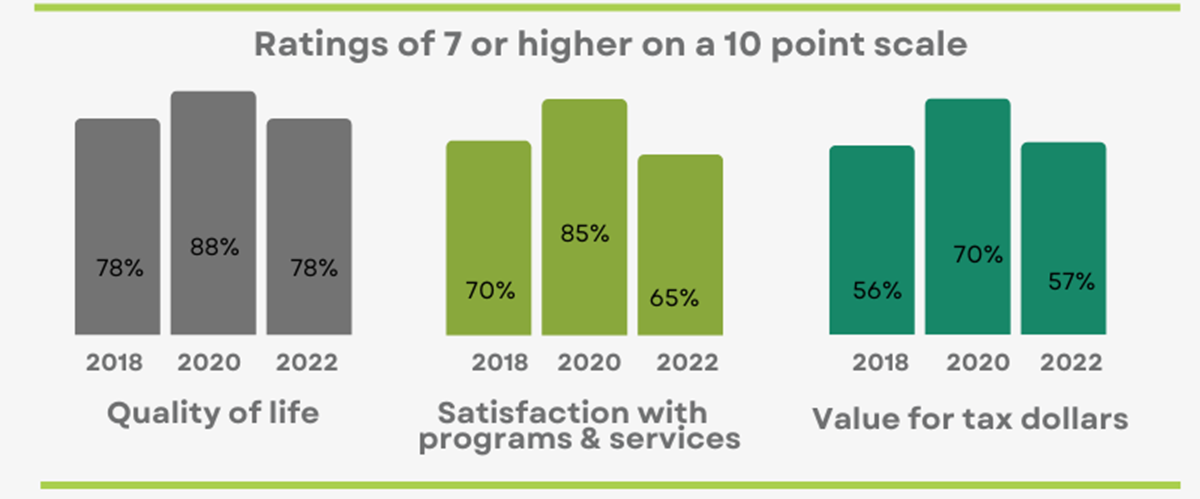
In 2022, 48% of residents rated their overall quality of life an 8 or higher on a 10-point scale while 78% gave a rating of 7 or higher. This was down significantly from 2020 but remained on par with the baseline in 2018. Quality of life was highest amongst homeowners, higher income households and those 55 plus.
A new question was added in 2022 asking respondents to identify the aspects of St. John’s that most contribute to their quality of life. Top mentions included parks and recreation (32%); easy access to amenities (17%); friendly people (9%); access to shopping facilities (8%); easy commuting (7%) and low crime rate (7%).

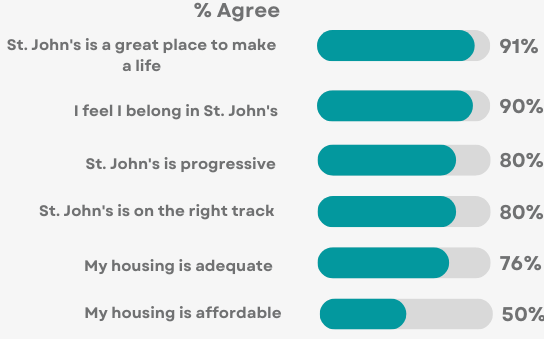
Overall, a 80% agree that the City is inclusive, on the right track, and a progressive city. Further, at least 90% agreed that St. John’s is a great place to live, welcoming, and a place they are proud to say they live and feel that they belong.
Satisfaction with City Programs and Services
In 2022, 65% of residents rated their overall satisfaction with the programs and services provided by the City of St. John’s a 7 or higher on a 10-point scale while 39% gave a rating of 8 or higher. Both measures were significantly down in comparison to 2020 but comparable to 2018.
There are significant gaps in satisfaction by home ownership, age and income. Those 55 plus exhibited a higher level of satisfaction compared to those in the younger age groups (73% vs. 60%).
Satisfaction was lowest among residents in Ward 5 (57%) and Ward 2 (60%). This was significantly different compared to Ward 1 (71%) and Ward 3 (70%).
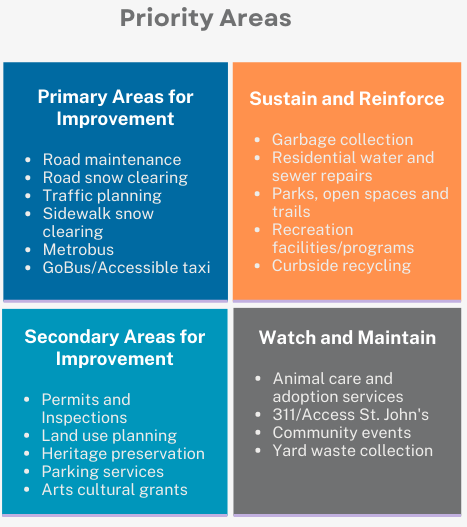
The perceived importance of City programs and services held relatively steady in comparison to 2020. Top five areas are road snow clearing (96%); garbage collection (95%); residential water and sewer repairs (94%); parks, open spaces and trails (94%) and road maintenance (92%).
Satisfaction with city programs and services has declined in most areas, with the exception of yard waste collection, which has increased over the 2020 survey.
Primary areas for improvement (largest gaps between perceived importance and satisfaction) are relatively unchanged. Road maintenance, road and sidewalk snow clearing, and traffic planning are still in this category. Both conventional and accessible public transit services have moved into this category in 2022.

Taxation and Capital Spending
Overall, 57% of residents who own their home and pay property taxes rated the overall value of what they receive for their tax dollars a 7 or higher while 28% gave a rating of 8 or higher on a 10-point scale. Perceived value for tax dollars among homeowners was highest among those 55 plus, and those living in Ward 2.
Overall, city-owned and operated non-profit housing remains the top ranked priority area for capital spending on non-essential infrastructure. The percentage of residents ranking green spaces in the top three decreased by 10 percentage points to 44% in 2022 while the proportion identifying cycling infrastructure as a top three priority increased by 6 percentage points to 27%.
90% of respondents support balancing investments between providing basic services and additional programs/services to enhance quality of life.
Communications and Engagement
Overall, 46% of residents surveyed had direct contact with the City over the past 12 months. Among this group (n=280), residents continued to express positive views towards their interactions.
86% of respondents say staff are courteous, helpful and knowledgeable; 81% get the information they are looking for; 66% believe that customer service is a priority for the City; and 67% say we respond in a timely manner.
The one weakest area continued to be allowing residents to have meaningful input into decision making for which agreement declined from 60% in 2020 to 51% in 2022.
Overall, seven-in-ten residents surveyed had used the City’s website which continued an upward trend seen in 2020. Usage of online services did trend upward year-over-year. Meanwhile, satisfaction (% rating 8 or higher) ranged from 43% for engagestjohns.ca to 85% for the Curb It app.
Residents were asked to rate the City on five measures of communications and accountability from poor to excellent. Consistent with previous years, the City was rated highest in terms of keeping residents informed (66%) and lowest in terms of managing the City’s money responsibly (47%) and being accountable (47%).
Overall, 82% indicated they have some level of trust in the city, a decrease of 5 percentage points from 2020 (87%). This was driven largely by a drop in those who trust the city a great deal (42 vs. 30%). The level of trust was relatively consistent across various wards, with Ward 1 exhibiting the most positive results (86% having some level of trust).
New Questions on Personal Finances and Housing
Overall, 18% indicated they were struggling financially, with renters (37%) and those with an income of less than $50,000 (42%) struggling the most. Those in the younger age group (18-34) and residents who are relatively new to the City (10 years or less) were also slightly more likely to cite their household struggling financially (27% and 28% respectively).
On the housing questions, 6% indicated their housing is not affordable and 3% said their housing was not adequate. Renters were less likely to report their home as affordable (35%) or adequate (58%). This is the same for those in the lowest income category. 34% said their home was affordable and 60% said it was adequate. Those identifying as a visible minority and LGBTQ2IA+ reported lower levels of housing affordability at 30% and 34% respectively.
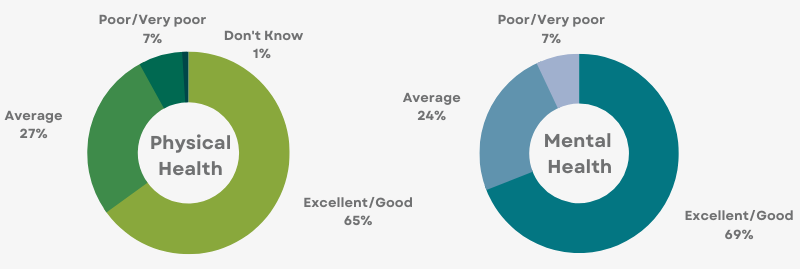
Overall, 65% of residents reported having excellent or good physical health and 69% reported excellent or good mental health, while one-quarter rated their physical health and mental health as average. People with disabilities were the most likely to report their physical (32%) and mental (19%) health as poor or very poor.

Contact
Contact Us


